Corporate LinX - Documentation Library
Accessing the Log Stream
You access this functionality through the App Management Tabs. From here, you can see any API calls that are being made in the system at the time.
The UI
When you access the log stream tab, you’re greeted with something that looks like this:
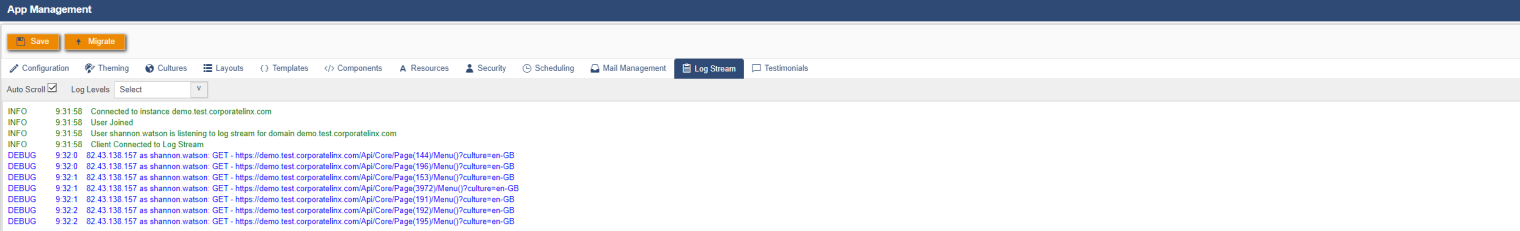
Here, you can see the API calls that are made when you hover over the navigation menu in our demo site. The toolbar options at the top of the page allow you toggle on and off “Auto Scroll”, and select what levels you want to be logged into the console. This allows you to easily debug and see what errors occur from what API calls.
From the dropdown you can select what you would like to see in the log stream,
- DEBUG - displays useful information for developers to diagnose any issues.
- INFO - displays any informational API calls, essentially displaying anything that's the "normal" flow of the application being used. These are usually displayed in blue text in the log stream.
- WARN - displays potential issues that will not affect the current operation but may lead to issues. These are usually displayed in yellow text in the log stream.
- ERROR - displays any problems affecting the functionality. These are usually displayed in red text in the log stream.
- FATAL - displays critical issues that result in a system failure and often lead to the system shut down.